Pearsons Correlation: Difference between revisions
| (6 intermediate revisions by the same user not shown) | |||
| Line 5: | Line 5: | ||
[[File:Histogram.png| 400px]] | [[File:Histogram.png| 400px]] | ||
=Distributions= | =Distributions= | ||
==Introduction== | |||
Next we look at types of distributions<br> | Next we look at types of distributions<br> | ||
[[File:Dist1.png| 400px]]<br> | [[File:Dist1.png| 400px]]<br> | ||
==Normal== | |||
First up normal distribution, the bell curve, or Gaussian distribution. There are names for a sample and a population<br> | |||
*The mean is in the centre of the curve and given x̄ pronounced x-bar (sample), the greek symbol μ and is pronounced mu (population) | |||
*The standard deviation is the spread of the curve, the symbol is '''S''' for sample and the greek symbol '''σ''' pronounced sigma (population) | |||
*Large standard deviation means a wide bell curve | |||
*Small standard deviation means a narrow bell curve | |||
[[File:Norm dist.png| 400px]]<br> | |||
The formula we use for standard deviation depends on whether the data is being considered a population of its own, or the data is a sample representing a larger population. | |||
*If the data is being considered a population on its own, we divide by the number of data points, '''N'''. | |||
*If the data is a sample from a larger population, we divide by one fewer than the number of data points in the sample, '''n-1'''. | |||
[[File:Standard deviation.png|200px]]<br> | |||
There are some rules about the percentage contained in steps away from the mean | |||
*1 step away is 68% of the data | |||
*2 steps away is 95% of the data | |||
*3 steps away is 99.7% of the data | |||
=Area Under a Curve= | |||
You can calculate the area under a curve with this. Thinking maths would be easier now.<br> | |||
[[File:Dydx.png|200px]]<br> | |||
So here is what we are looking at<br> | |||
[[File:Dydx example.png|400px]]<br> | |||
My memory is poor, googled this and it turns out you basic fit n-rectangles under the curve to get the value. Here the area we are looking for is divided into 5 rectangles. I was looking for a better way<br> | |||
[[File:Integration.png|600px]]<br> | |||
=Estimating Mean= | =Estimating Mean= | ||
Latest revision as of 05:31, 18 January 2025
Introduction
This is hopefully going to be about Pearsons Correlation however there were pre-reqs so
Histograms
so quick reminder, you create a set of bins and put data into them to try and understand the distribution.

Distributions
Introduction
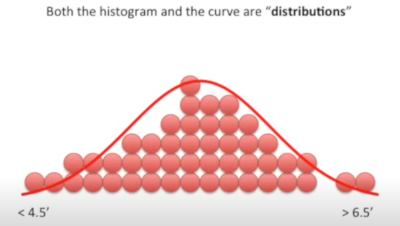
Next we look at types of distributions
Normal
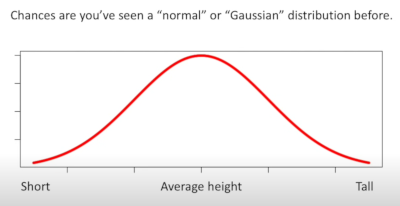
First up normal distribution, the bell curve, or Gaussian distribution. There are names for a sample and a population
- The mean is in the centre of the curve and given x̄ pronounced x-bar (sample), the greek symbol μ and is pronounced mu (population)
- The standard deviation is the spread of the curve, the symbol is S for sample and the greek symbol σ pronounced sigma (population)
- Large standard deviation means a wide bell curve
- Small standard deviation means a narrow bell curve
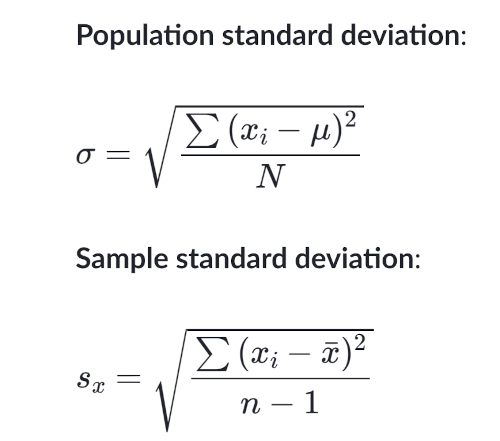
The formula we use for standard deviation depends on whether the data is being considered a population of its own, or the data is a sample representing a larger population.
- If the data is being considered a population on its own, we divide by the number of data points, N.
- If the data is a sample from a larger population, we divide by one fewer than the number of data points in the sample, n-1.
There are some rules about the percentage contained in steps away from the mean
- 1 step away is 68% of the data
- 2 steps away is 95% of the data
- 3 steps away is 99.7% of the data
Area Under a Curve
You can calculate the area under a curve with this. Thinking maths would be easier now.
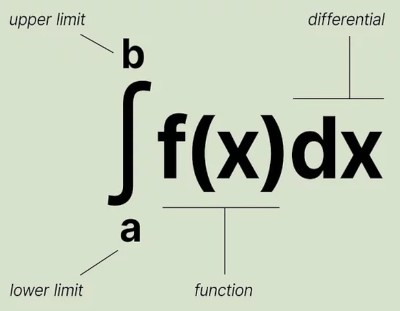
So here is what we are looking at
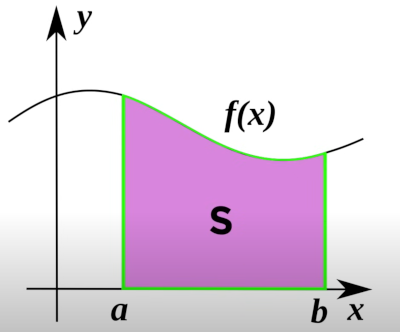
My memory is poor, googled this and it turns out you basic fit n-rectangles under the curve to get the value. Here the area we are looking for is divided into 5 rectangles. I was looking for a better way
