Least Squares: Difference between revisions
Created page with "=Introduction= This is my first math page to capture what is meant by least squares. I want to explain in a way that I can reread, remember and understand. Good look.This is also known as linear regression, fitting a line to data =What is it= So at first this looked easy enough. We measure the distance from the average on the y for each point and square the values.<br> 400px" |
|||
| Line 2: | Line 2: | ||
This is my first math page to capture what is meant by least squares. I want to explain in a way that I can reread, remember and understand. Good look.This is also known as linear regression, fitting a line to data | This is my first math page to capture what is meant by least squares. I want to explain in a way that I can reread, remember and understand. Good look.This is also known as linear regression, fitting a line to data | ||
=What is it= | =What is it= | ||
So at first this looked easy enough. We measure the distance from the average on the y for each point and square the values.<br> | So rewording this as I start to understand, we have a set of data points and what we are trying to achieve is to find a line which minimizes the amount of difference (known as errors) between the data point and the line for all data points | ||
=How do we do it= | |||
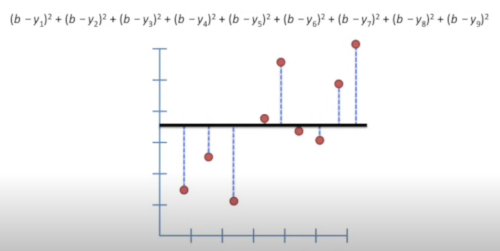
So at first this looked easy enough. We measure the distance from the average on the y for each point and square the values. The number is known as '''the sum of the squared residuals'''<br> | |||
[[File:Lsq1.png|400px]] | [[File:Lsq1.png|400px]] | ||
Next used a sloped line and calculated the same.<br> | |||
[[File:Lsq2.png|400px]] | |||
Calculating the value when the line is sloped proved to be another video required<br> | |||
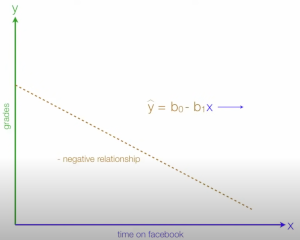
Here is a negative relationship<br> | |||
[[File:Lsq3.png|300px]]<br> | |||
=Terms= | |||
*Positive relationship This is when the linear line is positive going upwards | |||
*Negative relationship This is when the linear line is negative going down | |||
*Residual is the distance from the line for a given data point | |||
*The sum of the squared residuals This is the sum of all the data point risiduals | |||
*ŷ (Y-hat) This refers to a predicated value of y | |||
Revision as of 00:23, 18 January 2025
Introduction
This is my first math page to capture what is meant by least squares. I want to explain in a way that I can reread, remember and understand. Good look.This is also known as linear regression, fitting a line to data
What is it
So rewording this as I start to understand, we have a set of data points and what we are trying to achieve is to find a line which minimizes the amount of difference (known as errors) between the data point and the line for all data points
How do we do it
So at first this looked easy enough. We measure the distance from the average on the y for each point and square the values. The number is known as the sum of the squared residuals
 Next used a sloped line and calculated the same.
 Calculating the value when the line is sloped proved to be another video required
Here is a negative relationship

Terms
- Positive relationship This is when the linear line is positive going upwards
- Negative relationship This is when the linear line is negative going down
- Residual is the distance from the line for a given data point
- The sum of the squared residuals This is the sum of all the data point risiduals
- ŷ (Y-hat) This refers to a predicated value of y