Pearsons Correlation: Difference between revisions
Jump to navigation
Jump to search
Created page with "=Introduction= This is hopefully going to be about Pearsons Correlation however there were pre-reqs so =Histograms= so quick reminder, you create a set of bins and put data into them to try and understand the distribution. 400px =Estimating Mean=" |
|||
| Line 4: | Line 4: | ||
so quick reminder, you create a set of bins and put data into them to try and understand the distribution. | so quick reminder, you create a set of bins and put data into them to try and understand the distribution. | ||
[[File:Histogram.png| 400px]] | [[File:Histogram.png| 400px]] | ||
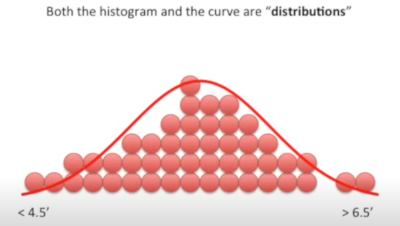
=Distributions= | |||
Next we look at types of distributions<br> | |||
[[File:Dist1.png| 400px]]<br> | |||
=Estimating Mean= | =Estimating Mean= | ||

