R Squared: Difference between revisions
| Line 26: | Line 26: | ||
So we know this is formula for <math>R^2</math><br> | So we know this is formula for <math>R^2</math><br> | ||
<math> | <math> | ||
R^2 = | R^2 = \frac{\text{SS}_{\text{model}}}{\text{SS}_{\text{tot}}} | ||
</math> | </math> | ||
<br> | <br> | ||
Revision as of 02:41, 23 April 2025
Introduction
This is all about R².
My Thoughts
Least Squares Review
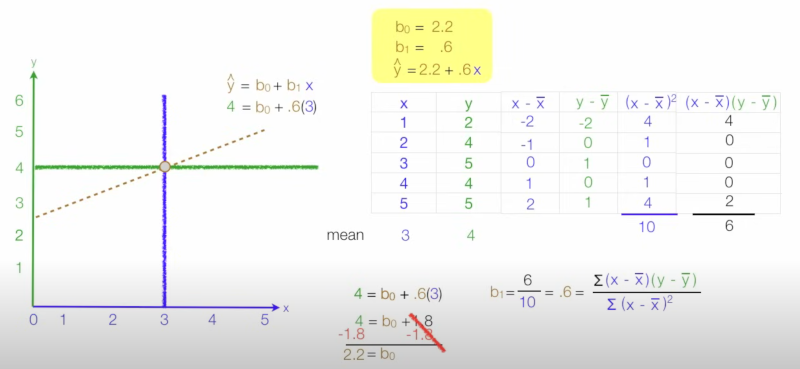
Most of this requires you to think about a dataset with lots of points. What we are trying to do is with least squares is find the best fit for a line for our data points. Once we have this we could maybe predict for a new data point what the y-value might be given the x-value. Here is the formula
And here is an example of usage

R Squared
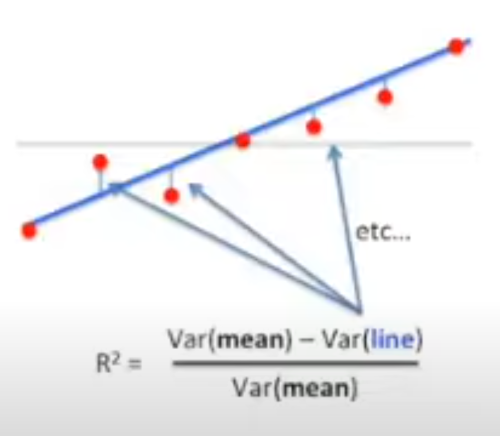
With we are looking at the variances (changes) using the mean and the line. Squaring means we don't care about negative or positive.
What is the difference
Well I guess R² = R squared. R² is the variance between a dependent variable and an independent variable in terms of percentage. Therefore 0.4 R² = 40% and R = 0.2. I guess I agree that using R² does provide an easier way to understand what you mean however there is no sign on R².
Formula for R²
This is given by

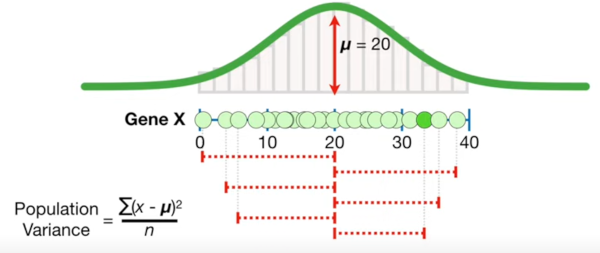
A reminder of how we calculate variance, we add up the differences from the mean like below. Note this shows a population and we should divide by n-1 not n but I liked the graphic.

This was a nice picture

F
So we know this is formula for
Where
- is the sum of squared residuals, which measures the variability of the observed data around the predicted values.
- is the total sum of squares, which measures the variability of the observed data around the mean.
So now we move on to F
- 𝑆𝑆 mean: Represents the sum of squares around the mean.
- 𝑆𝑆 fit: Represents the sum of squares explained by the fit or model.
- 𝑃𝑓𝑖𝑡−𝑃𝑚𝑒𝑎𝑛: Captures the difference between individual predicted values (𝑃𝑓𝑖𝑡) and their mean (𝑃𝑚𝑒𝑎𝑛).
- 𝑛−𝑃𝑓𝑖𝑡: Adjusts for the total observations relative to predicted fit values.