ESP32
Introduction
As the little grey cells get older probably time to give to pointers to myself
UDev Rules
Here is what I use for my WROOM 32d in /etc/udev/rules.d/98-esp32.rules
ATTRS{idVendor}=="10c4", ATTRS{idProduct}=="ea60", MODE="0666", ENV{ID_MM_DEVICE_IGNORE}="1"I also add myself to the dailout group with
sudo usermod -a -G dialout $USER
Building openocd
This is a cop out as I should fix the errors and feed back but here we go.
Ignore maybe-uninitialized
#pragma GCC diagnostic push
#pragma GCC diagnostic ignored "-Wmaybe-uninitialized"
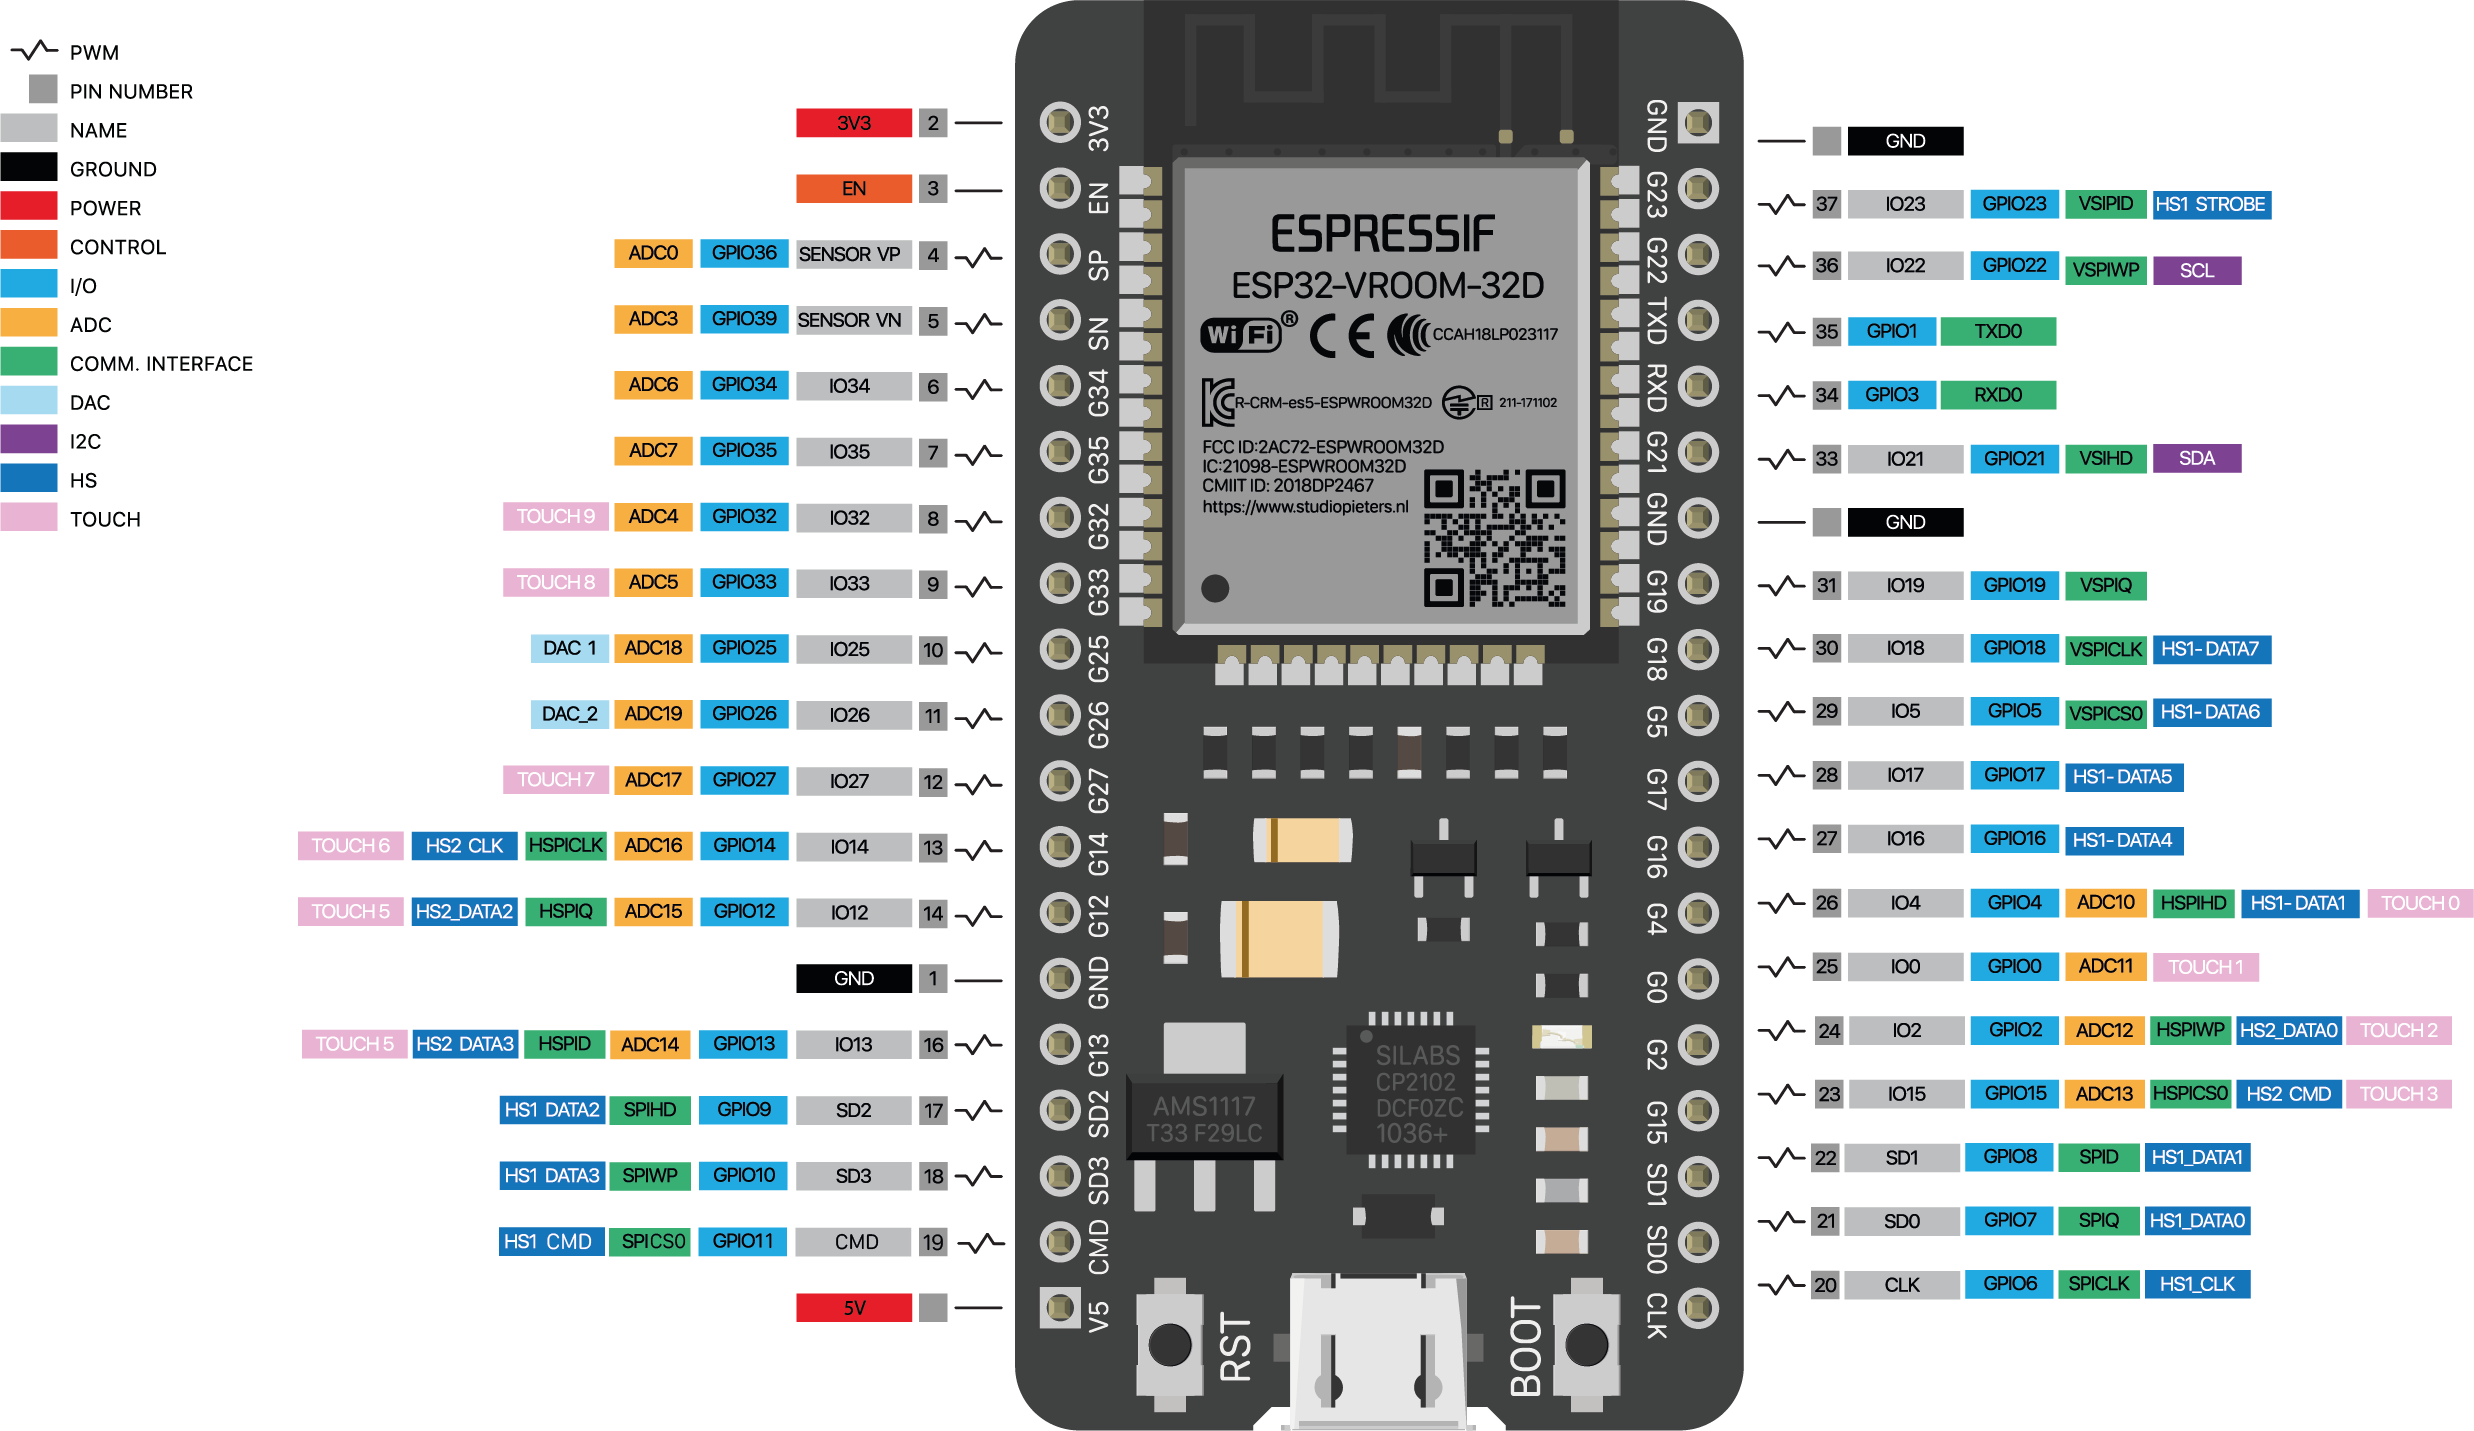
Pinout for ESP32
This is the pinout for my ESP32
UDEV
To make sure the device is recogised we need to add rules to /etc/udev/rules.d/
This is my board and my UART interface. The plugdev is the important bit as we need to not run things as root for some strange reason.
ATTRS{idVendor}=="0403", ATTRS{idProduct}=="6001", MODE="660", GROUP="plugdev", TAG+="uaccess"
ATTRS{idVendor}=="10c4", ATTRS{idProduct}=="ea60", MODE="660", GROUP="plugdev", TAG+="uaccess"
openocd and FT232R
Openocd User Manual
This can be found [here]
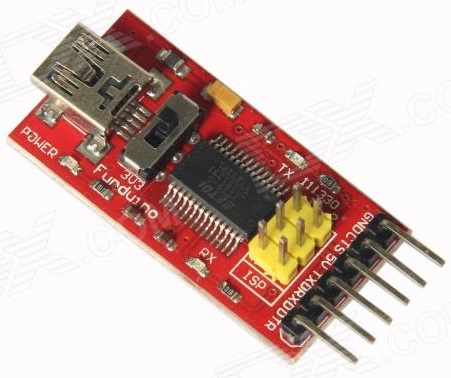
FT232
This is what I believe my FT232 is [here]
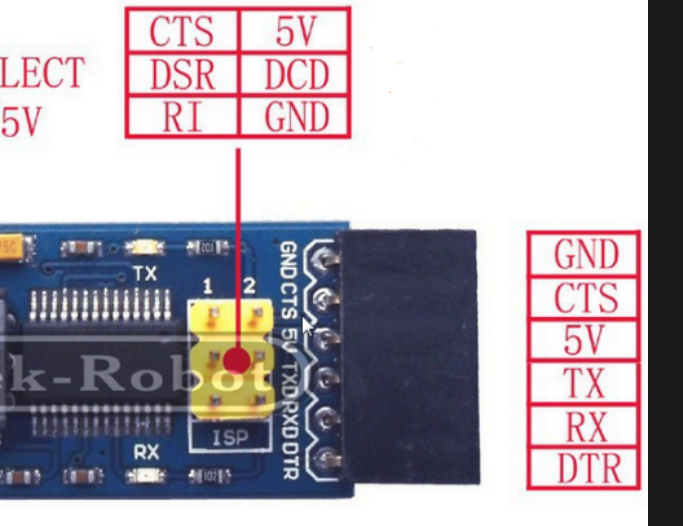
The connector shown for a similar board gives
Connecting
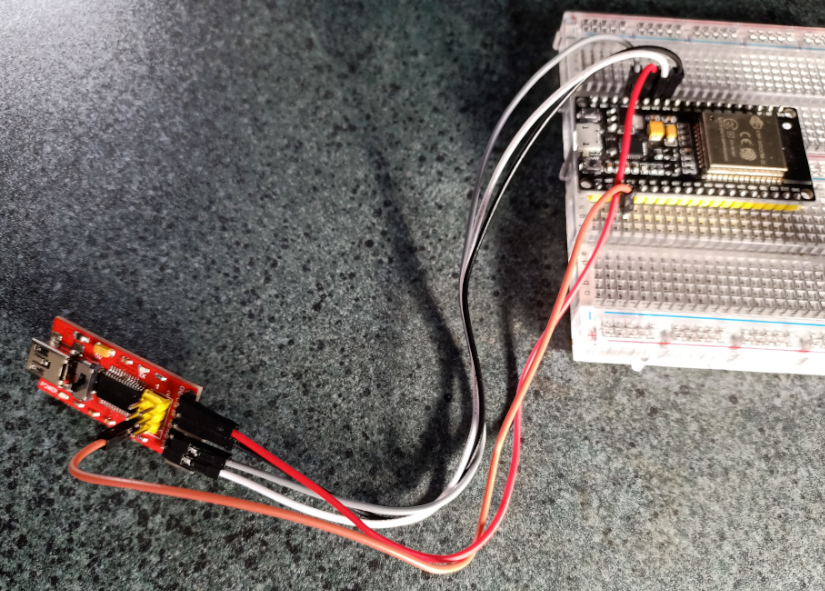
The following was suggested to get the JTAG interface to work.
GPIO15=TDO
GPIO12=TDI
GPIO13=TCK
GPIO14=TMS
GND=GND
ft232r.cfg
This is what I have used for ft232.cfg
interface ft232r

adapter_khz 3000

ft232r_tck_num TXD
ft232r_tdi_num RXD
ft232r_tdo_num RI
ft232r_tms_num CTS
ft232r_trst_num DTR
ft232r_srst_num DCD
Running Open OCD Debugger
OCD Side
The scripts are written in TCL. Here is the command to run
cd ~/.espressif/tools/openocd-esp32/v0.10.0-esp32-20210401/openocd-esp32/bin
./openocd  -d3   -f ../share/openocd/scripts/interface/ft232r.cfg -f ../share/openocd/scripts/board/esp-wroom-32.cfg
GDB Side
The gdbinit file
set remotetimeout 100
target remote :3333
mon reset halt
thb app_main
x $a1=0
c
And here is the build and execute
cp -r \$IDF_PATH/examples/get-started/blink .
cd blink/
cd build
esptool.py --chip esp32 -p /dev/ttyUSB0 -b 460800 --before=default_reset --after=hard_reset write_flash --flash_mode dio --flash_freq 40m --flash_size 2MB 0x8000 partition_table/partition-table.bin 0x1000 bootloader/bootloader.bin 0x10000 blink.bin
cd -
xtensa-esp32-elf-gdb   -x gdbinit build/blink.elf
Distilled Script
I have worked through the scripts provided with openocd and this is the script I believe is run from the above command.
interface ft232r
#ft232r_restore_serial 0x15

ft232r_tdi_num TXD
ft232r_tck_num DTR
ft232r_tdo_num RXD
ft232r_tms_num CTS
# trst/srst are not used but must have different values than above
ft232r_trst_num DCD
ft232r_srst_num RI

#reset_config none

adapter_khz 500


set ESP32_FLASH_VOLTAGE 3.3

# ESP_COMMON.CFG

set _FLASH_SIZE "auto"
puts "==== FLASH_SIZE $_FLASH_SIZE"

set _SEMIHOST_BASEDIR "."
puts "==== SEMIHOST_BASEDIR $_SEMIHOST_BASEDIR"


###
### configure_esp_workarea
###
proc configure_esp_workarea { TGT CODE_ADDR CODE_SZ DATA_ADDR DATA_SZ } {
        #WARNING: be careful when selecting working ares for code and data, they should not overlap due to ESP32 physical memory mappings
        $TGT configure -work-area-phys $CODE_ADDR -work-area-virt $CODE_ADDR -work-area-size $CODE_SZ -work-area-backup 1
        # since ESP32 cannot use single address space for code and data we need additional working area to keep data
        $TGT configure -alt-work-area-phys $DATA_ADDR -alt-work-area-virt $DATA_ADDR -alt-work-area-size $DATA_SZ -alt-work-area-backup 1
}


###
### configure_esp_workarea
###
proc configure_esp_flash_bank { TGT DRV SIZE } {
        set _SIZE SIZE
	# special value for flash driver
        set _SIZE 0

        # whole flash for programming purposes
        # TODO: remove it when support for GDB's 'load' comand is implemented
        flash bank $TGT.flash $DRV 0x0 $_SIZE 0 0 $TGT
        # So define mapped flash regions as separate flashes
        # OOCD creates memory map using registered flash banks
        flash bank $TGT.irom $DRV 0x0 0 0 0 $TGT
        flash bank $TGT.drom $DRV 0x0 0 0 0 $TGT
}

# ESP32.cfg

# The ESP32 only supports JTAG.
# transport select jtag

# Target specific registers
set EFUSE_BLK0_RDATA1_REG 0x3ff5A004

set _CHIPNAME esp32
puts "==== CHIPNAME $_CHIPNAME"

set _CPUTAPID 0x120034e5
puts "==== CPUTAPID $_CPUTAPID"

set _ONLYCPU 3
puts "==== ONLYCPU $_ONLYCPU"

set _FLASH_VOLTAGE $ESP32_FLASH_VOLTAGE
puts "==== FLASH_VOLTAGE $_FLASH_VOLTAGE"

set _CPU0NAME cpu0
set _CPU1NAME cpu1
set _TARGETNAME_0 $_CHIPNAME.$_CPU0NAME
set _TARGETNAME_1 $_CHIPNAME.$_CPU1NAME

set _RTOS "FreeRTOS"
puts "==== RTOS $_RTOS"


jtag newtap $_CHIPNAME $_CPU0NAME -irlen 5 -expected-id $_CPUTAPID
jtag newtap $_CHIPNAME $_CPU1NAME -irlen 5 -expected-id $_CPUTAPID

target create $_TARGETNAME_0 $_CHIPNAME -endian little -chain-position $_TARGETNAME_0 -coreid 0 -rtos $_RTOS
configure_esp_workarea $_TARGETNAME_0 0x40090000 0x3400 0x3FFC0000 0x10000
configure_esp_flash_bank $_TARGETNAME_0 $_CHIPNAME $_FLASH_SIZE

# APP-CPU
target create $_TARGETNAME_1 $_CHIPNAME -endian little -chain-position $_TARGETNAME_1 -coreid 1 -rtos $_RTOS
configure_esp_flash_bank $_TARGETNAME_1 $_CHIPNAME $_FLASH_SIZE
target smp $_TARGETNAME_0 $_TARGETNAME_1


$_TARGETNAME_0 esp32 flashbootstrap $_FLASH_VOLTAGE
$_TARGETNAME_0 xtensa maskisr on
$_TARGETNAME_0 xtensa smpbreak BreakIn BreakOut
$_TARGETNAME_0 esp semihost_basedir $_SEMIHOST_BASEDIR

$_TARGETNAME_1 configure -event gdb-attach {
    $_TARGETNAME_1 xtensa smpbreak BreakIn BreakOut
    # necessary to auto-probe flash bank when GDB is connected
    halt
}
puts "==================================== Scooby doo 1"
Debug Progress
I have logged the bug https://github.com/espressif/openocd-esp32/issues/157 which is still open. For comparison here is the log which I am told contains no errors however it hangs on the GDB side.
iwiseman@oliver:~/dev/openocd-esp32$ grep -v  ^Debug  ~/iain_500.log
Open On-Chip Debugger  v0.10.0-esp32-20210401 (2021-04-01-15:45)
Licensed under GNU GPL v2
For bug reports, read
	http://openocd.org/doc/doxygen/bugs.html
User : 13 1 options.c:57 configuration_output_handler(): debug_level: 3
User : 14 1 options.c:57 configuration_output_handler():
Info : 36 1 transport.c:117 allow_transports(): only one transport option; autoselect 'jtag'
User : 81 2 options.c:57 configuration_output_handler(): adapter speed: 500 kHz
User : 82 2 options.c:57 configuration_output_handler():
User : 86 2 command.c:770 jim_echo(): WARNING: boards/esp-wroom-32.cfg is deprecated, and may be removed in a future release.
Warn : 89 2 transport.c:297 jim_transport_select(): Transport "jtag" was already selected
	$_TARGETNAME_0 xtensa smpbreak BreakIn BreakOut
	# necessary to auto-probe flash bank when GDB is connected
	halt

		$_TARGETNAME_1 xtensa smpbreak BreakIn BreakOut
		# necessary to auto-probe flash bank when GDB is connected
		halt

Info : 420 4 server.c:311 add_service(): Listening on port 6666 for tcl connections
Info : 421 4 server.c:311 add_service(): Listening on port 4444 for telnet connections
Info : 504 20 core.c:1449 adapter_init(): clock speed 500 kHz
Info : 518 28 core.c:1027 jtag_examine_chain_display(): JTAG tap: esp32.cpu0 tap/device found: 0x120034e5 (mfg: 0x272 (Tensilica), part: 0x2003, ver: 0x1)
Info : 519 28 core.c:1027 jtag_examine_chain_display(): JTAG tap: esp32.cpu1 tap/device found: 0x120034e5 (mfg: 0x272 (Tensilica), part: 0x2003, ver: 0x1)
Info : 560 1820 xtensa.c:1859 xtensa_poll(): esp32.cpu0: Target halted, PC=0x4000941D, debug_reason=00000000
Info : 570 3601 xtensa.c:1859 xtensa_poll(): esp32.cpu1: Target halted, PC=0x400076DD, debug_reason=00000000
Info : 643 3953 server.c:311 add_service(): Listening on port 3333 for gdb connections
Info : 644 4181 server.c:100 add_connection(): accepting 'gdb' connection on tcp/3333
Warn : 650 4181 FreeRTOS.c:702 FreeRTOS_update_threads(): No symbols for FreeRTOS!
	$_TARGETNAME_0 xtensa smpbreak BreakIn BreakOut
	# necessary to auto-probe flash bank when GDB is connected
	halt

Info : 772 31204 xtensa.c:1859 xtensa_poll(): esp32.cpu0: Target halted, PC=0x40091C2A, debug_reason=00000001
Info : 774 31212 esp_xtensa_smp.c:234 esp_xtensa_smp_update_halt_gdb(): Set GDB target to 'esp32.cpu0'
Info : 948 45312 esp_xtensa.c:368 esp_xtensa_get_mappings(): Flash mapping 0: 0x10020 -> 0x3f400020, 23 KB
Info : 949 45312 esp_xtensa.c:368 esp_xtensa_get_mappings(): Flash mapping 1: 0x20020 -> 0x400d0020, 75 KB
Info : 1043 71826 xtensa.c:1859 xtensa_poll(): esp32.cpu0: Target halted, PC=0x40091C2A, debug_reason=00000001
Info : 1177 85248 esp_xtensa.c:883 esp_xtensa_probe(): Auto-detected flash bank 'esp32.cpu0.flash' size 4096 KB
Info : 1178 85248 esp_xtensa.c:885 esp_xtensa_probe(): Using flash bank 'esp32.cpu0.flash' size 4096 KB
Info : 1282 112259 xtensa.c:1859 xtensa_poll(): esp32.cpu0: Target halted, PC=0x40091C2A, debug_reason=00000001
Info : 1455 126342 esp_xtensa.c:368 esp_xtensa_get_mappings(): Flash mapping 0: 0x10020 -> 0x3f400020, 23 KB
Info : 1456 126342 esp_xtensa.c:368 esp_xtensa_get_mappings(): Flash mapping 1: 0x20020 -> 0x400d0020, 75 KB
Info : 1457 126342 esp_xtensa.c:885 esp_xtensa_probe(): Using flash bank 'esp32.cpu0.irom' size 76 KB
Info : 1561 153325 xtensa.c:1859 xtensa_poll(): esp32.cpu0: Target halted, PC=0x40091C2A, debug_reason=00000001
Info : 1734 167393 esp_xtensa.c:368 esp_xtensa_get_mappings(): Flash mapping 0: 0x10020 -> 0x3f400020, 23 KB
Info : 1735 167393 esp_xtensa.c:368 esp_xtensa_get_mappings(): Flash mapping 1: 0x20020 -> 0x400d0020, 75 KB
Info : 1736 167393 esp_xtensa.c:885 esp_xtensa_probe(): Using flash bank 'esp32.cpu0.drom' size 24 KB
Info : 1738 167393 gdb_server.c:1011 gdb_new_connection(): New GDB Connection: 1, Target esp32.cpu0, state: halted
Warn : 1742 167393 gdb_server.c:441 gdb_put_packet_inner(): negative reply, retrying
<threads>
</threads>
#02'
<threads>
</threads>
#02'
<memory type="flash" start="0x00000000" length="0x400000">
<property name="blocksize">0x1000</property>
</memory>
<memory type="ram" start="0x00400000" length="0x3f000000"/>
<memory type="flash" start="0x3f400000" length="0x6000">
<property name="blocksize">0x1000</property>
</memory>
<memory type="ram" start="0x3f406000" length="0xcca000"/>
<memory type="flash" start="0x400d0000" length="0x13000">
<property name="blocksize">0x1000</property>
</memory>
<memory type="ram" start="0x400e3000" length="0xbff1d000"/>
</memory-map>
#23'
Info : 1839 167653 core.c:1027 jtag_examine_chain_display(): JTAG tap: esp32.cpu0 tap/device found: 0x120034e5 (mfg: 0x272 (Tensilica), part: 0x2003, ver: 0x1)
Info : 1841 167653 core.c:1027 jtag_examine_chain_display(): JTAG tap: esp32.cpu1 tap/device found: 0x120034e5 (mfg: 0x272 (Tensilica), part: 0x2003, ver: 0x1)
Info : 1901 168534 xtensa.c:1797 xtensa_poll(): esp32.cpu0: Debug controller was reset.
Info : 1904 168545 xtensa.c:1803 xtensa_poll(): esp32.cpu0: Core was reset.
Info : 1912 170303 xtensa.c:1859 xtensa_poll(): esp32.cpu0: Target halted, PC=0x500000CF, debug_reason=00000000
Info : 1995 170854 xtensa.c:1803 xtensa_poll(): esp32.cpu0: Core was reset.
Info : 2003 172610 xtensa.c:1859 xtensa_poll(): esp32.cpu0: Target halted, PC=0x40000400, debug_reason=00000000
Info : 2010 172623 xtensa.c:1797 xtensa_poll(): esp32.cpu1: Debug controller was reset.
Info : 2013 172633 xtensa.c:1803 xtensa_poll(): esp32.cpu1: Core was reset.
Info : 2021 174376 xtensa.c:1859 xtensa_poll(): esp32.cpu1: Target halted, PC=0x40000400, debug_reason=00000000
Getting Started IDF
Uploading
With my ESP32 you have to hold the boot and reset to do an upload
idf.py -p /dev/ttyUSB0 flash
Monitoring
To monitor you can do the following. This can be exited using the ctrl + ] (like telnet
idf.py -p /dev/ttyUSB0 monitor
Second Attempt CJMCU-2232 FT2232HL
I eventually gave up trying to get the FT232R to work. I believe it is because there in no chip to handle the JTAG and the UART at the same time this let me to look at alternatives
Plugged two these in but both blew up when connected.
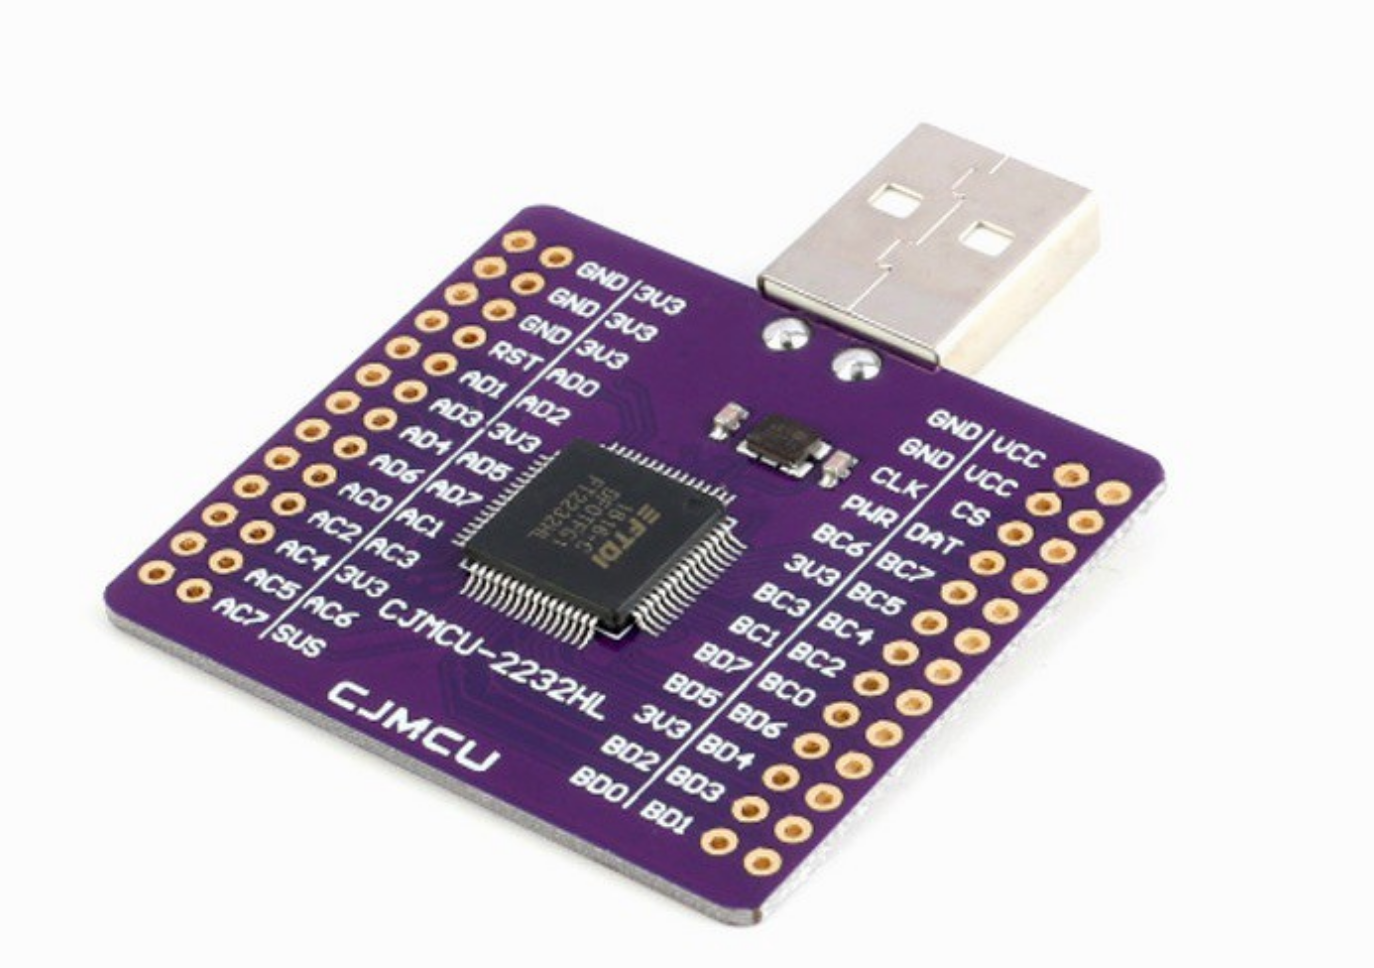
I used the connections provided on by here
- GPIO12 — AD1 (TDI)
- GPIO15 — AD2 (TDO)
- GPIO13 — AD0 (TCK)
- GPIO14 — AD3 (TMS)
- GND — GND
I did not plug in the VCC and still do not understand why this happened.
Third Attempt ESP-PROG
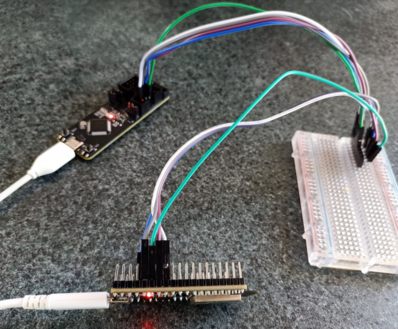
Current Wiring
- GPIO12 — AD1 (TDI) Purple
- GPIO15 — AD2 (TDO) Blue
- GPIO13 — AD0 (TCK) Grey
- GPIO14 — AD3 (TMS) White
- GND — (GND) Green
Udev Rules
Revisiting this I could not get to work because of udev rules
Info : Listening on port 6666 for tcl connections
Info : Listening on port 4444 for telnet connections
Error: libusb_open() failed with LIBUSB_ERROR_ACCESS
Error: no device found
Error: unable to open ftdi device with vid 0403, pid 6010, description '*', serial '*' at bus location '*'
Error: no device found
Error: unable to open ftdi device with vid 0403, pid 6014, description '*', serial '*' at bus location '*'
Adding the following worked for me
ATTRS{idVendor}=="0403", ATTRS{idProduct}=="6010", MODE="0666", ENV{ID_MM_DEVICE_IGNORE}="1"
ATTRS{idVendor}=="10c4", ATTRS{idProduct}=="ea60", MODE="0666", ENV{ID_MM_DEVICE_IGNORE}="1"
I now am trying and seen it work the standard way to approach this using the esp-prog. These are relatively cheap to buy ~$30 and can be bought online but no where in NZ
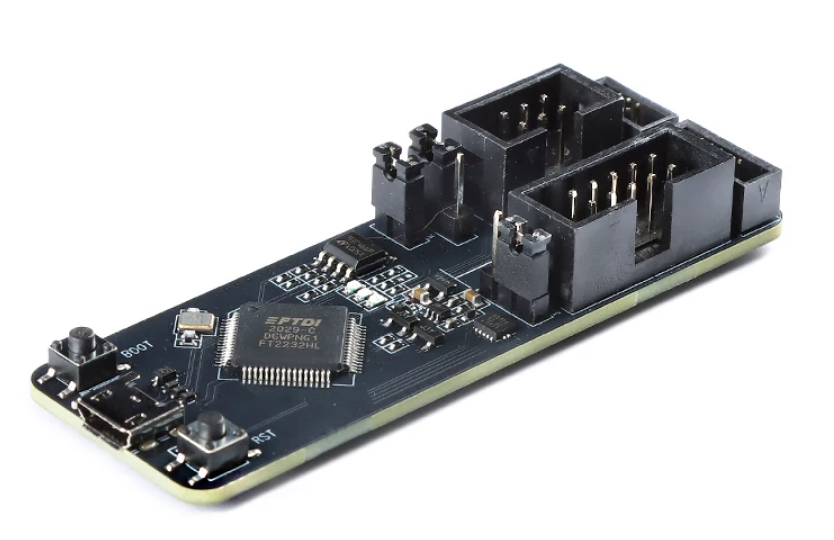
An here it is all wired up. Feel I have learnt a bit along the way
To wire this up we use the following
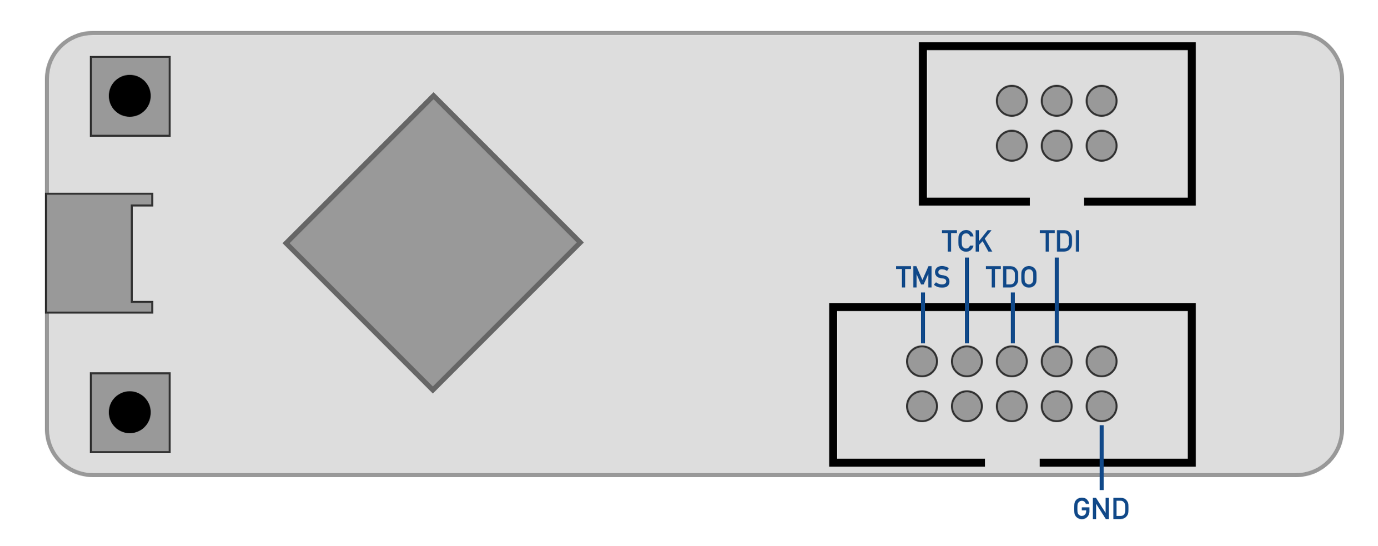
I put the gnd in the middle row of as the end pin is power on one side. Having blown up the previous attempts I wanted to be doubly sure.
When the ESP32 is connected to the ESP-PROG the flash does not work. This is because the GPIO12 is which is a bootstrap pin that controls VDD_SDIO. To override this we can use the following
python `which espefuse.py` --port /dev/ttyUSB2 set_flash_voltage 3.3V
For the openocd we do the following
get_idf
cd ~/.espressif/tools/openocd-esp32/v0.11.0-esp32-20220706/openocd-esp32
bin/openocd -s share/openocd/scripts -f interface/ftdi/esp32_devkitj_v1.cfg -f board/esp-wroom-32.cfg

Open On-Chip Debugger  v0.11.0-esp32-20220706 (2022-07-06-15:48)
Licensed under GNU GPL v2
For bug reports, read
	http://openocd.org/doc/doxygen/bugs.html
adapter speed: 20000 kHz

WARNING: boards/esp-wroom-32.cfg is deprecated, and may be removed in a future release.
Info : Listening on port 6666 for tcl connections
Info : Listening on port 4444 for telnet connections
Info : ftdi: if you experience problems at higher adapter clocks, try the command "ftdi tdo_sample_edge falling"
Info : clock speed 20000 kHz
Info : JTAG tap: esp32.cpu0 tap/device found: 0x120034e5 (mfg: 0x272 (Tensilica), part: 0x2003, ver: 0x1)
Info : JTAG tap: esp32.cpu1 tap/device found: 0x120034e5 (mfg: 0x272 (Tensilica), part: 0x2003, ver: 0x1)
Info : [esp32.cpu0] Debug controller was reset.
Info : [esp32.cpu0] Core was reset.
Error: Unexpected OCD_ID = 00000000
Error: Unexpected OCD_ID = 00000000
Error: Unexpected OCD_ID = 00000000
Warn : target esp32.cpu1 examination failed
Error: Unexpected OCD_ID = 00000000
Error: Unexpected OCD_ID = 00000000
Error: Unexpected OCD_ID = 00000000
Info : starting gdb server for esp32.cpu0 on 3333
Info : Listening on port 3333 for gdb connections

...
For the debugging we do need to do the following. Set up the environment and get to your project directory
. ./esp/esp-idf/export.sh
cd ~/dev/projects/ESP/hello_world
Make a gdbinit file
set remotetimeout 100
target remote :3333
mon reset halt
thb app_main
x $a1=0
c
Start debugging
xtensa-esp32-elf-gdb -x gdbinit build/hello-world.elf
When loaded we can add a breakpoint at line 30 and continue
[Switching to Thread 1073438564]

Thread 1 hit Temporary breakpoint 1, app_main () at ../main/hello_world_main.c:20
20	{
(gdb) b 37
Breakpoint 2 at 0x400d43a2: file ../main/hello_world_main.c, line 37.
(gdb) c
Continuing.
Note: automatically using hardware breakpoints for read-only addresses.
esp32.cpu0: Target halted, PC=0x400D43A2, debug_reason=00000001
Set GDB target to 'esp32.cpu0'
esp32.cpu1: Target halted, PC=0x400E345A, debug_reason=00000000

Thread 1 hit Breakpoint 2, app_main () at ../main/hello_world_main.c:37
37	    printf("test 1 %d, ", a);
(gdb) p a
$1 = 10
VS Code
Bug with VS Code
There is an expired cert in the build system. When build with VS Code extension this shows
Generating x509_crt_bundle
FAILED: esp-idf/mbedtls/x509_crt_bundle
cmd.exe /C "cd /D C:\Users\yahsa\Desktop\NTU\FYP\ESP_Workspace\blink\build\esp-idf\mbedtls && C:\Users\yahsa\esp.espressif\python_env\idf4.3_py3.8_env\Scripts\python.exe C:/Users/yahsa/esp/esp-idf/components/mbedtls/esp_crt_bundle/gen_crt_bundle.py --input C:/Users/yahsa/esp/esp-idf/components/mbedtls/esp_crt_bundle/cacrt_all.pem -q"
gen_crt_bundle.py: Invalid certificate in C:/Users/yahsa/esp/esp-idf/components/mbedtls/esp_crt_bundle/cacrt_all.pem
Invalid certificate
ninja: build stopped: subcommand failed.
The current fix was to remove the ECC-ACC from ./esp-idf/components/mbedtls/esp_crt_bundle/cacrt_all.pem
...

EC-ACC
======
-----BEGIN CERTIFICATE-----
MIIFVjCCBD6gAwIBAgIQ7is969Qh3hSoYqwE893EATANBgkqhkiG9w0BAQUFADCB8zELMAkGA1UE
BhMCRVMxOzA5BgNVBAoTMkFnZW5jaWEgQ2F0YWxhbmEgZGUgQ2VydGlmaWNhY2lvIChOSUYgUS0w
...
E/rKS03Z7lNGBjvGTq2TWoF+bCpLagVFjPIhpDGQh2xlnJ2lYJU6Un/10asIbvPuW/mIPX64b24D
5EI=
-----END CERTIFICATE-----

Hellenic Academic and Research Institutions RootCA 2011
=======================================================
...