Least Squares
Introduction
This is my first math page to capture what is meant by least squares. I want to explain in a way that I can reread, remember and understand. Good look.This is also known as linear regression, fitting a line to data
What is it
So rewording this as I start to understand, we have a set of data points and what we are trying to achieve is to find a line which minimizes the amount of difference (known as errors) between the data point and the line for all data points
How do we do it Part 1
So at first this looked easy enough. We measure the distance from the average on the y shown a b for each point and square the values. The number is known as the sum of the squared residuals
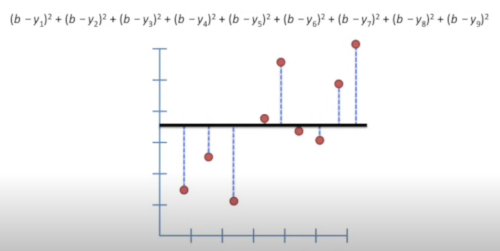
Next used a sloped line and calculated the same.

Calculating the value when the line is sloped proved to be another video required
How do we do it Part 2
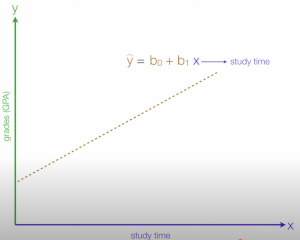
Here is a postive relationship and the formula (more to come)
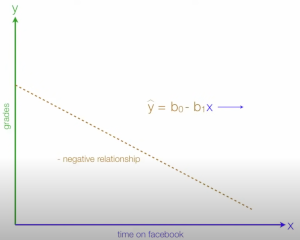
Here is a negative relationship and the formula (more to come)
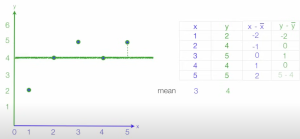
Getting there, next we do the same as above where we find the mean and calculate the distance from it for each data point.
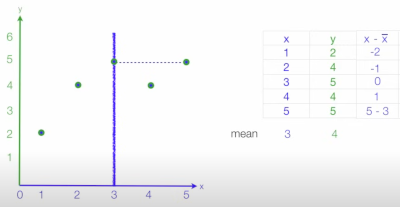
And now the other direction. Slightly different from above as we have done both x and y
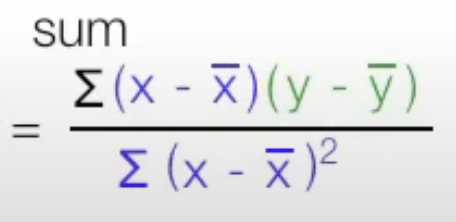
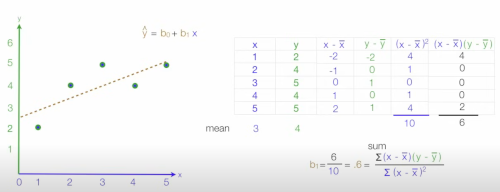
So we now set about calculating b₁. We do this using the formula
Where are values are
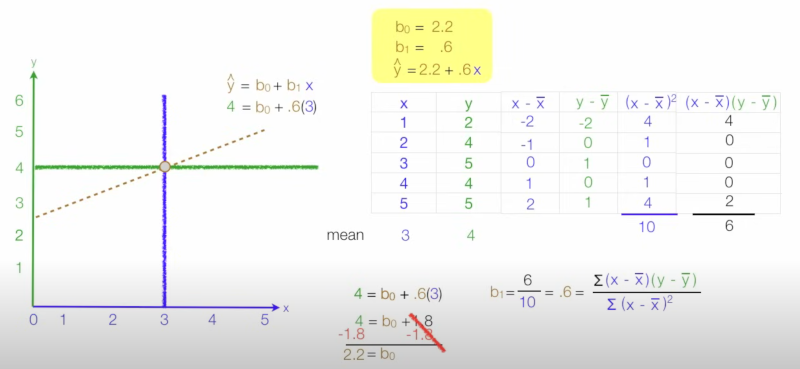
So now we have our final workings. For any give value of x we can find the value for ŷ
How do we do it Part 3
Going back to part 1 we see there are 3 concepts to learn
Concept 1
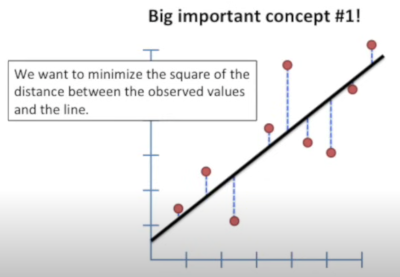
We want to minimize the square of the distance between observed values and the line. The observed values means the data points
Concept 2
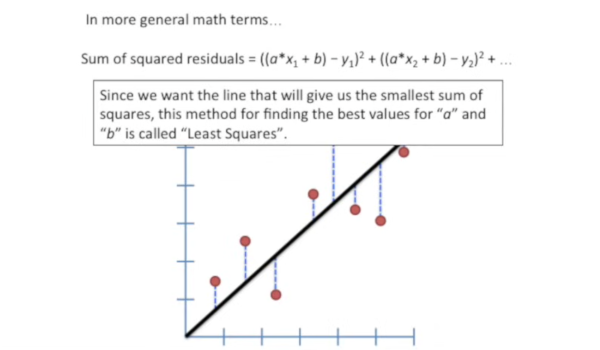
Have to look this up. Sigh! We came back to the formula. The generic line equation, which is y = a*x + b. Where
- a = the slope
- b = the intercept i.e. the location on the y-axis when x = 0
From the first formula we can express the sum of residuals like this
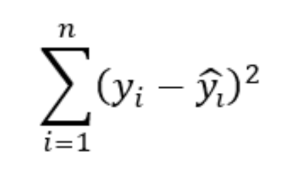
Now we know the formula for y shown above, the formula shown here now makes sense
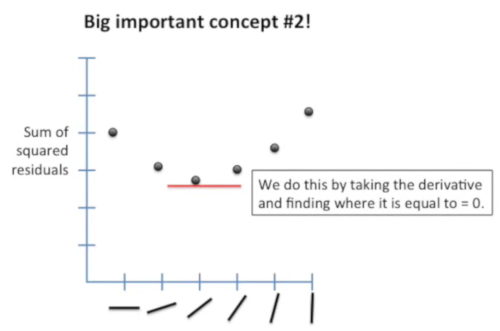
So reading about what a derivative is, and my guess is that it is a values the represents the rate of change between two data points.
Terms
- Positive relationship This is when the linear line is positive going upwards
- Negative relationship This is when the linear line is negative going down
- Residual is the distance from the line for a given data point
- The sum of the squared residuals This is the sum of all the data point risiduals
- ŷ (Y-hat) This refers to a predicated value of y
- Dependent variable This was the y-axis, not sure if this is typical, this is the impacted thing
- Independent variable This was on the x-axis, This was the thing that changes