Computer Organisation and Design
Introduction
This is me looking at theory and documenting what I need to know. Primarily this was driven from my electronics and not IT.
Pulse Trains
- Non-Periodic pulse trains are digital signals with any pulses over time
- Periodic pulse trains are pulses in fixed time like a clock signal
- T=period (seconds/cycle)
- tw = pulse width
- frequency = cycles/second or frequency = 1/T
- duty cycle = % of time period train = 1 or tw /T x 100%
Binary
Lots of talk about binary and how it works. This is a placeholder to remind me we needed to know about this. Good terms were
- LSB Least significant bit
- MSB Most significant bit
BCD Binary Code Decimal
This is where we encode a number using the digits rather than the value e.g. we encode 94 as a '9' and a '4'
In BCD 94 would

1001 0100
9    4
Multiplications and Divisions
Distributive law was mentioned. You can solve a problem using the order of operations using distributive law.
Given 5(3+4)

Order of operations would be 5(7) = 35
Distributive law would be (5x3)+(5x4) = 15 + 20 = 35
We looked at doubling a number below where each value could be solved with
 3x2 or (2 x 2) + (2 x 1) = 6
 6x2 or (2 x 4) + (2 x 2) = 12
12x2 or (2 x 8) + (2 x 4) = 24
 3 = 2  +   1 = 00000011
 6 = 4  +   2 = 00000110
12 = 8  +   4 = 00001100
24 = 16 +   8 = 00011000
48 = 32 +  16 = 00110000
96 = 64 +  32 = 01100000
192 = 128 + 64 = 11000000
We can multiply easily using the shift operators e.g.
a = a * 16 or 2 to the power of 4 or
a = a << 4;
Or divide with >>
b = b/8
b = b >> 3
Converting to Binary
Let take 89 and continue to divide by 2
 89 / 2 = 44 rem 1 - LSB
 44 / 2 = 22 rem 0
 22 / 2 = 11 rem 0
 11 / 2 =  5 rem 1
  5 / 2 =  2 rem 1
  2 / 2 =  1 rem 0
  1 / 2 =  0 rem 1
Therefore taking answers in reverse 89 = 01011001
ADC Explained
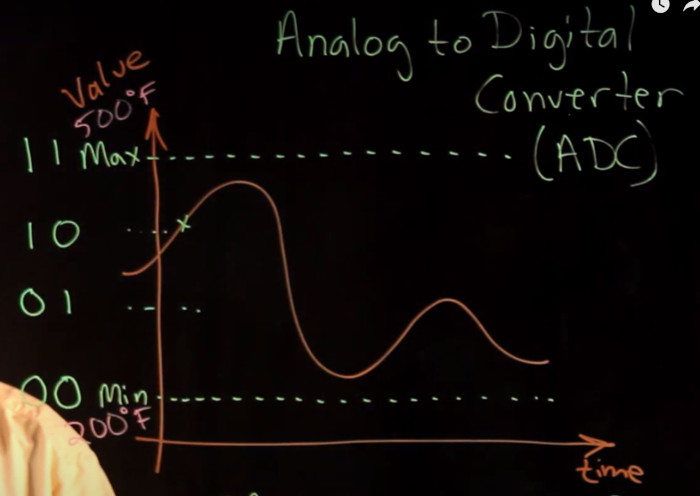
Really like this explanation for ADC. Obvious once you know. The bit depth represents how many divisions there are between the max and min values you are allowing. The image show an american cooker and they are using the following
- Min 300°F - Max 500°F
- Range is 200°F
- Bit Depth 8-bits
- Resolution is Range / By number of intervals which is 300 / 2⁸-1 (We minus one because we need the min and max for 1 byte) = 1.1764
Sampling and Sample Rates
Sampling Rate (Hz) = Number of samples /second. Nyquist Theorem suggests we need to same 2 as often as max
Average Ears here at 20Khz hence why audio is at 44.1 kHz
Gray Codes
This is a technique where we convert number from binary to gray. We do this because Gray reduces the bits we need to change to get to the next number. e.g. changing from 2 to 3 decimal requires a 1 bit change.
Here is a conversion table
| Decimal | BCD | Gray Code |
| 0 | 0000 | 0000 |
| 1 | 0001 | 0001 |
| 2 | 0010 | 0011 |
| 3 | 0011 | 0010 |
| 4 | 0100 | 0110 |
| 5 | 0101 | 0111 |
| 6 | 0110 | 0101 |
| 7 | 0111 | 0100 |
| 8 | 1000 | 1100 |
| 9 | 1001 | 1101 |
| 10 | 1010 | 1111 |
A can also convert to gray using the following technique
1/ Add a zero to the binary number to convert
2/ Iterate over the number, if the preceeding number is different put 1, if the same put 0

Example 1

1100

01100 Add a prefix of zero and go through each pair
 1010
Example 2
010111

0010111
 011100
Compliments
10s Compliment
Really liked this and a surprise. Take a simple sum
 5283
-2946
-----
 2337
Now if we follow these rules
1/ Subtract each of the second operator from 9
2/ Add 1 to the result
Gives
999999
002946
    +1
------
997054
Now use this number as the second operator and disregard the carry
 005283
+997054
 ------
 002337
2s Compliment
This is possible in binary to but no example is provided here. The process to convert from 2s compliment is to invert all the bits and add 1
Binary formats
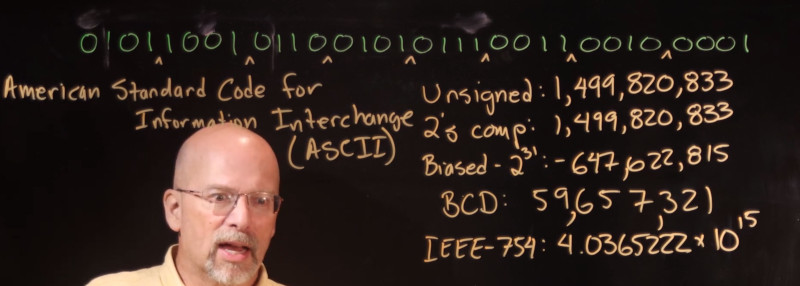
What was highlighted is that we need to be careful when given a binary number that we understand the format
10011000
= BCD is 1001 1000 or 9 and 8 = 98
= 2s  is 01101000 = -104
= unsigned is 152
Here we saw the formats covered including Baised and IEEE float point
Offset Biased N Notation
This is where we move number -127 on the number line
From Decimal
1/ Add N to decimal value
2/ Convert as if unsigned
  23
+127
 ===
 150
 10010110
To Decimal
1/ Convert to decimal as if unsigned
2/ Subtract N

00101111
      47
    -127
    ====
     -80
Overflow
With unsigned format we overflow when a number is carried beyond original e.g. 1111 +-0001 With 2s compliment to overflow when the sign byte changes for addition
UTF Encoding
Never done this and probably should know this but always googled the API to do it for me.
The first byte indicates how many subsequent bytes of data there are
If first byte starts with
- 0 = 1 byte and is the same a 7-bit ASCII
- 110 = 2 bytes UTF-8
- 1110 = 3 bytes UTF-8
- 11110 = 4 bytes UTF-8
Where more than one byte is provided each subsequent byte starts with 10 and uses the remaining 6 bits.
So as an example we have
11110000 10011111 10001101 10001110 00101011 11001111 10000000 00100001

We can tell the first is four bytes
 11110000 10011111 10001101 10001110

Second is 1 ascii
 00101011

Third is 2 bytes
 11001111 10000000

Last is 1 byte
 00100001
These values are BCD and split into nibbles (4 bytes) and this gives
 0001 1111 0011 0100 1110 -> U+01F34E
 0010 1011                -> U+002B
 0011 1100 0000           -> U+03C0
 0010 0001                -> U+0021
Note for all of the first byte we remove the 1s + 0 accept for 1 byte UTF where we remove the first two 0s.
State Machines
This is to summarise the excellent talk by intermation on state machines. This was the original reason for finding the excellent course on computers and led me to graph theory, truth tables, binary algebra logic and karnaugh maps. The process was used this approach
- System Level Design
- State Diagram Design
- Assign numbers to States
- Create Truth Tables
- Create Circuit Diagram
System Level Design
The requirement so to design a traffic light system for east-west, north-south
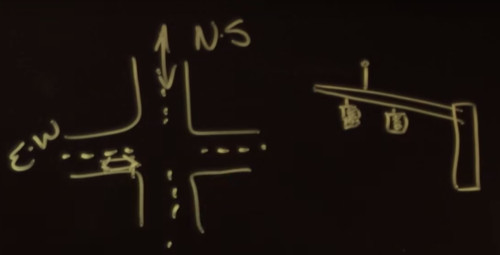
T = a timer
T = 0 when not running
T = 1 when running

1) Timer starts when east-west car detected
2) Timer will time East-West Green
3) Timer will time East-West Yellow
The input will be the timer and the outputs will be which lights are on
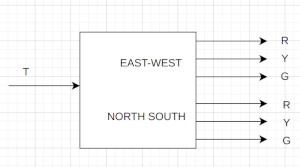
State Diagram Design
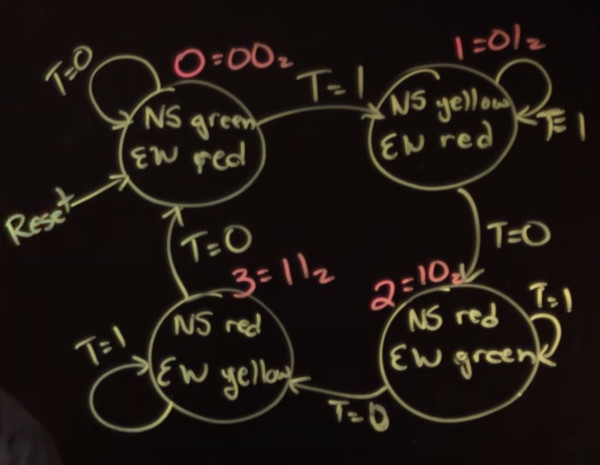
We use something called graph theory to do this. Here is the diagram for the traffic lights requirements. The reset is the initial state and the arrows determine why the state changes
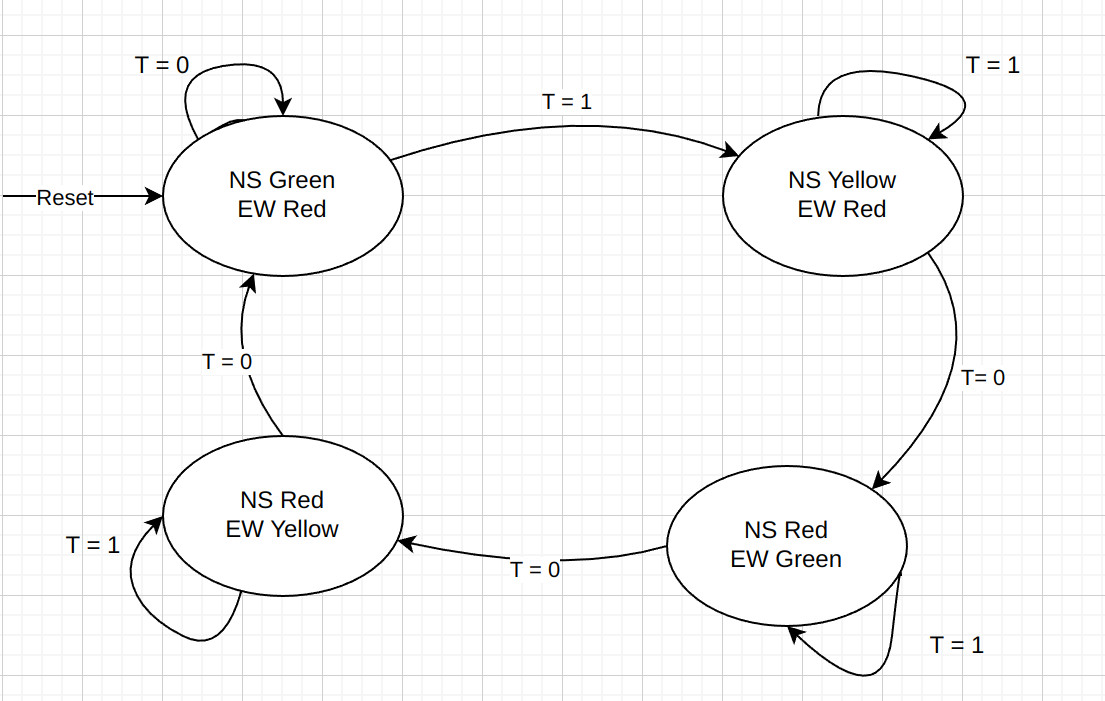
Used DrawIO but it still turned out awful. I did look a bit further and found graphviz will render a diagram but you need to understand the syntax. I see there is a lexer for it in pygments
digraph finite_state_machine {
    rankdir=LR;
    size="8,5"

    node [shape = doublecircle]; S;
    node [shape = point ]; qi

    node [shape = circle];
    qi -> S;
    S  -> q1 [ label = "a" ];
    S  -> S  [ label = "a" ];
    q1 -> S  [ label = "a" ];
    q1 -> q2 [ label = "b" ];
    q2 -> q1 [ label = "b" ];
    q2 -> q2 [ label = "b" ];
}
Resulting in file
 This has a lot of support in VS Code including a previewer so maybe the way to go. And ten minutes later
digraph finite_state_machine {
    rankdir=LR;
    size="8,5"

    node [shape = doublecircle]; S0;
    node [shape = point ]; qi

    node [shape = circle];
    qi -> S0;
    S0 -> S1 [ label =  "T = 1"];
    S1 -> S2 [ label =  "T = 0"];
    S2 -> S3 [ label =  "T = 0"];
    S3 -> S0  [ label =  "T = 0"];
    S0 -> S0  [ label =  "T = 0"];
    S1 -> S1  [ label =  "T = 1"];
    S2 -> S2  [ label =  "T = 1"];
    S3 -> S3  [ label =  "T = 1"];
}
Assign Numbers to States
So we number the states by going from 0-3 for each state. This means there are four possible states. The state can be held in two bits. as the combinations are 00, 01, 10, 11.
In the truth tables we label the bits by
- least significant bit as S₀ and
- most significant bit as S₁
Create Truth Tables
Next we create two tables, one for the output and one for the next state truth table.
Output Truth table
We just take the states and write the expected lights. If we look at S₁ = 0 and S₀ = 1 we can match the table to the expected lights in the diagram
| S₁ | S₀ | Rₙₛ | Yₙₛ | Gₙₛ | Rₑ𝓌 | Yₑ𝓌 | Gₑ𝓌 |
| 0 | 0 | 0 | 0 | 1 | 1 | 0 | 0 |
| 0 | 1 | 0 | 1 | 0 | 1 | 0 | 0 |
| 1 | 0 | 1 | 0 | 0 | 0 | 0 | 1 |
| 1 | 1 | 1 | 0 | 0 | 0 | 1 | 0 |
Next State Truth table
This table shows the next state base on where we are in the state diagram. If we look at the value of S₁ S₀ and T we can write down the expected next state
| S₁ | S₀ | T | S₁` | S₀` |
| 0 | 0 | 0 | 0 | 0 |
| 0 | 0 | 1 | 0 | 1 |
| 0 | 1 | 0 | 1 | 0 |
| 0 | 1 | 1 | 0 | 1 |
| 1 | 0 | 0 | 1 | 1 |
| 1 | 0 | 1 | 1 | 0 |
| 1 | 1 | 0 | 0 | 0 |
| 1 | 1 | 1 | 1 | 1 |
Create Circuit Diagram
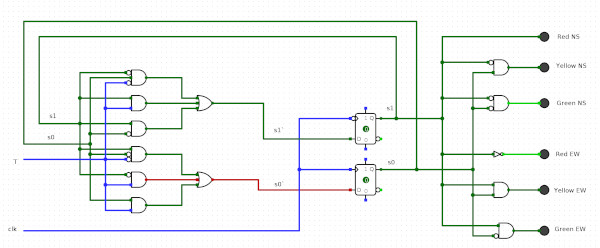
Next we can create a circuit diagram from the Next state truth table. I used logisim-snapcraft from snap. Took a while but OK
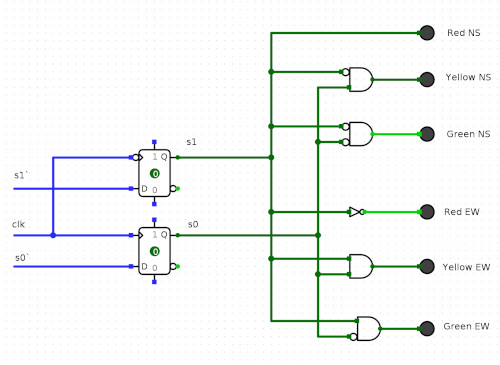
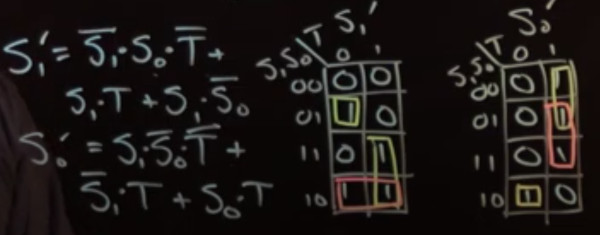
Create Karnaugh map from Truth Table
Transferring the truth table we can calculate the next state from a given state. Putting this on Wiki was too hard so his is a picture
